This is the honest version of a predictor app. It cannot tell you what happens next — nothing can — but it can tell you exactly what each step is worth and what it costs in probability, which is the only information that actually exists before a round.
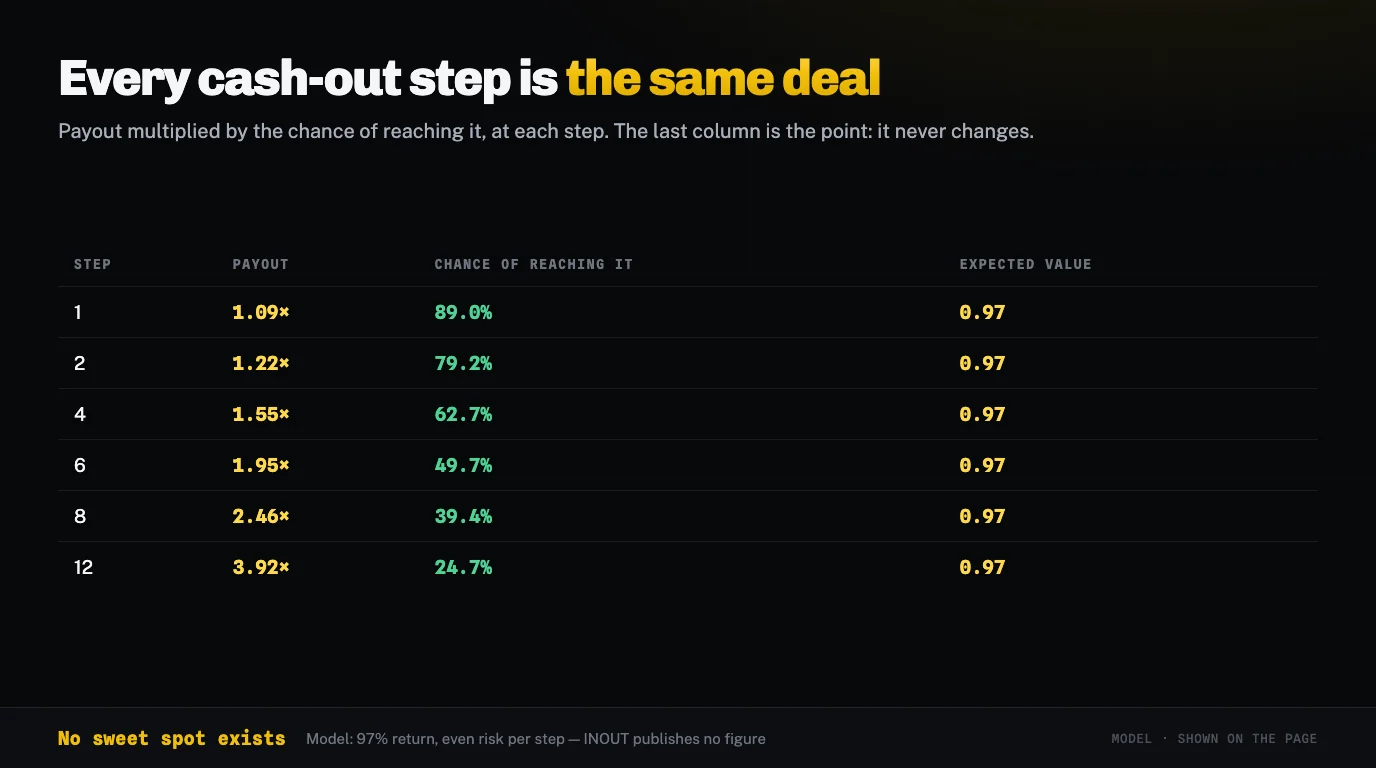
Payout is what a stake of 1 returns if you stop there. Survival is the chance of reaching that step. Expected value is the two multiplied — and note that it is the same number in every row.
| Step | Payout | Chance of reaching it | Return on 1,000 | Expected value |
|---|---|---|---|---|
| 1 | 1.12× | 87.5% | 1,120 | 0.98 |
| 2 | 1.28× | 76.6% | 1,280 | 0.98 |
| 3 | 1.46× | 67.0% | 1,463 | 0.98 |
| 4 | 1.67× | 58.6% | 1,672 | 0.98 |
| 5 | 1.91× | 51.3% | 1,911 | 0.98 |
| 6 | 2.18× | 44.9% | 2,184 | 0.98 |
| 7 | 2.50× | 39.3% | 2,496 | 0.98 |
| 8 | 2.85× | 34.4% | 2,852 | 0.98 |
| 9 | 3.26× | 30.1% | 3,260 | 0.98 |
| 10 | 3.73× | 26.3% | 3,725 | 0.98 |
| 11 | 4.26× | 23.0% | 4,257 | 0.98 |
| 12 | 4.87× | 20.1% | 4,866 | 0.98 |
It reads 0.97 on every single row. Cashing out at step one and cashing out at step twelve have identical expected value, because the payout is priced to make them identical. There is no clever step, no sweet spot and no exploitable row — only different shapes of the same deal.
Variance. A low step wins often and pays little; a high step almost never wins and pays a lot. Same average, wildly different experience, and wildly different chance of your balance surviving a bad hour. Choose the shape you can actually sit through.
It is not a predictor and it cannot be turned into one. Each step is settled independently on the operator’s server, so no table, formula or history can carry information about the round you are about to play.
It is also a model rather than the game’s paytable: INOUT publishes 98% for Chicken Road, and this table uses it. The per-step chance is our assumption. The relationship it shows — equal expected value on every row — holds for any honest crash game regardless of the exact figures.
A calculator for this game is not a strategy tool. It is a way of seeing a trade that the interface deliberately shows you one step at a time.
Both curves bend, in opposite directions, from the first step. That is why the game feels generous early and turns without warning: nothing on screen changes character at the point where the trade stops being worth it, because there is no such point — the trade is the same bad deal at every step, by design.
Multiply the payout by the chance of reaching it at any step and you get the same number: the stake, less the house edge. Banking at step two and banking at step eight have identical expected values. What differs is the shape of the outcome — many small wins against rare large ones — and that is a choice about variance, not about value.
Every page selling one is selling a preference dressed as a calculation. Choose the step that matches how you want the session to feel, then hold it, because the only thing that reliably loses money here is changing the plan while the number climbs.
The studio publishes a return rate and does not publish the per-step survival chance. We assume an even risk per step, which produces the right shape and is not a measurement. If a game weights its risk differently — more forgiving early, harsher later — the curve steepens and every conclusion above still holds.
The studio’s own page adds that the return rate is «configurable according to operator settings». So the figure this table is built on is what the studio offers, not necessarily what your casino runs — and no operator we checked publishes its setting. The shape is reliable. The exact numbers are as reliable as the operator chooses to make them.
Tell you when to stop. That is not a gap in the maths; it is that the maths has no opinion. The stopping rule has to come from what you can afford to lose, and no table can supply that number for you.
Not recommendations. Three internally consistent ways to play the same curve, so the trade is visible rather than theoretical.
Small multipliers taken often. Most rounds end in a win, the wins are minor, and the balance drifts down slowly at the rate of the house edge. It is the version of this game that feels safest and it loses at exactly the same rate as the others.
Long runs of nothing punctuated by a large payout. Identical expected value, wildly different experience, and a much higher chance of a session that ends at zero before the large payout arrives. Bankroll matters far more here than in the first plan.
The commonest approach and the only one that is actually worse than the others. Every decision made while the number is rising is made under the influence of the number rising, and the near miss that follows is the format working as designed.
Not the maths — it is the same. It is that the first two are decisions and the third is a reaction. This is the single practical thing a table like this can teach, and it is worth more than any step number it could produce.
Stated because every other calculator in this category implies the opposite.
Nothing here forecasts the next round. The curve describes the shape of a bet across many rounds, and a single round has no memory of any table.
The studio publishes the return and not the per-step chance. Our even-risk assumption is stated on the table itself rather than hidden in a footnote, because a number whose provenance you cannot see is a number you should not act on.
The studio states the return is adjustable by the casino, and no casino we checked publishes its setting. The table is the studio’s offer, not a measurement of your lobby.
Seeing that the trade does not improve at any step, which the interface never shows you all at once. That single realisation is the entire value of putting the numbers in a column.
Every cash-out step in Chicken Road has the same expected value, because the payout is priced against the odds of reaching it. What changes between rows is variance: how often you win and how much arrives when you do. Use the table to pick a step you can hold to, then hold to it — that is the entire strategy the game permits.

